jsp页面如何实现动态股票形式的图
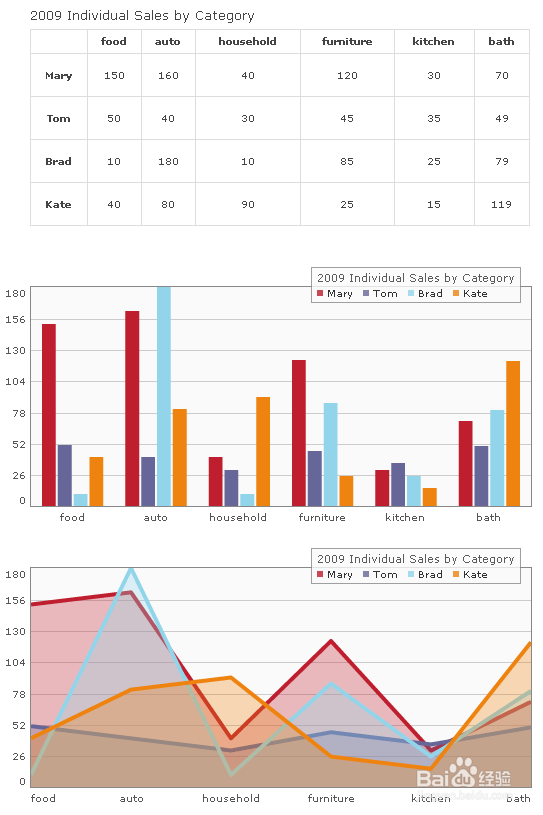
1、1. jQuery Visualize Plugin
支持的图表: 柱状图,饼图,面积图,折线图
系统需求:jQuery ,exanvas(已包括)
浏览器支持:IE6,7,8, Firefox 2, firefox 3.5, Safari 3, 4, Opera 9.HTML5 canvas在IE中不支持但是Google维护了一个类库能将Canvas翻译成VML,这样可以允许在任意版本IE中运行
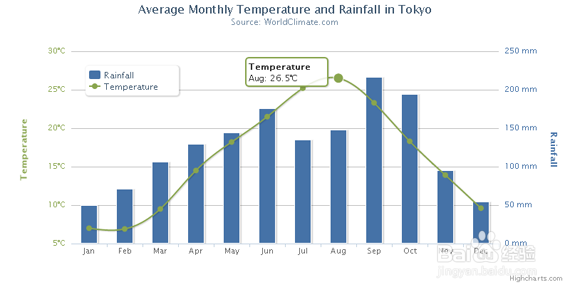
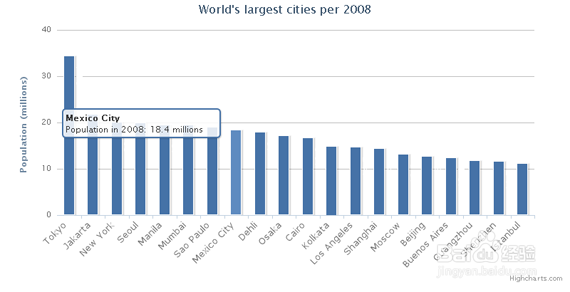
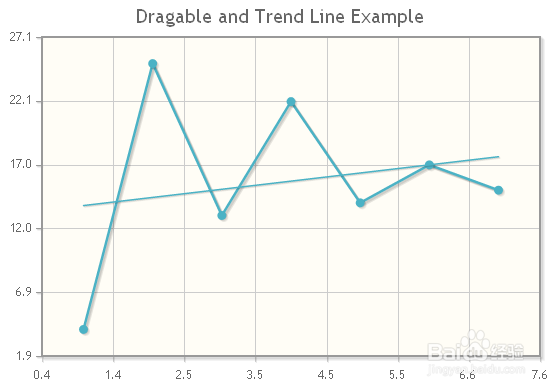
2、2. Highcharts
支持的图表: 柱状图,饼图,面积图,折线图,样条图,圆柱图,散点图,Areaspline
系统需求:jQuery 或者 MooTools
浏览器支持: IE6,7,8, Firefox 2, firefox 3.5, Safari 3, 4, Opera 9, IPhone!
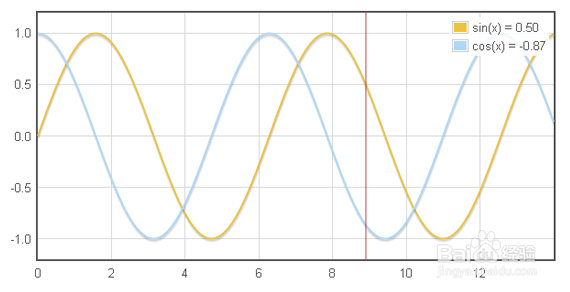
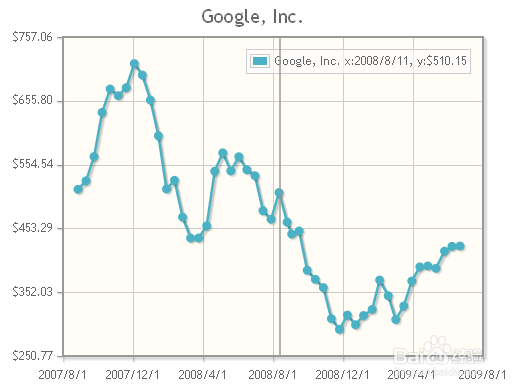
3、3. Flot
支持的图表: 柱状图,饼图,点状图,折线图
系统需求:jQuery
浏览器支持: IE6,7,8, Firefox 2, firefox 3.5, Safari 3, 4, Opera 9, Konqueror 4+
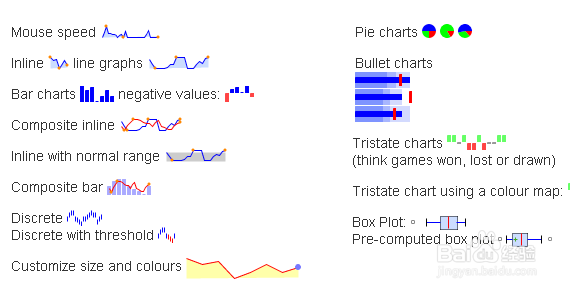
4、4. jQuery Sparklines
支持的图表: 柱状图,饼图,折线图,Tristate, Bullet, Box Plot
系统需求:jQuery
浏览器支持: IE6,7,8, Firefox 2, firefox 3.5, Safari 3, 4, Opera 9, Google Chrome
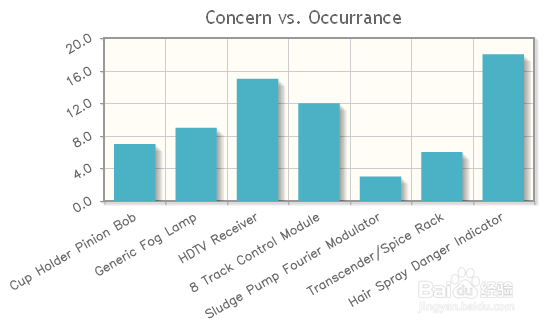
5、5. jqPlot
支持的图表: 柱状图,饼图,折线图
系统需求:jQuery
浏览器支持: IE6,7,8, Firefox 2, firefox 3.5, Safari 3, 4, Opera 9, Google Chrome
阅读量:21
阅读量:70
阅读量:44
阅读量:121
阅读量:48