Matlab直方图(柱状图)histogram
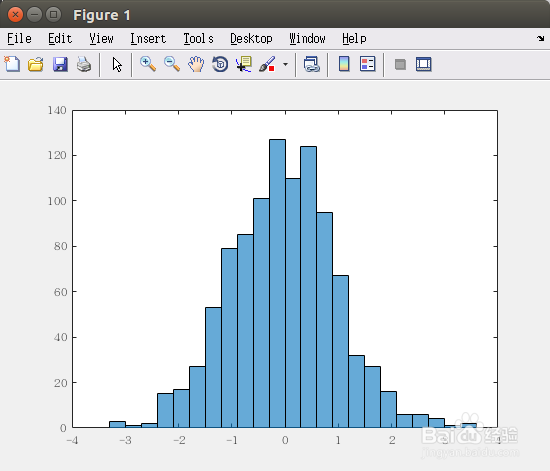
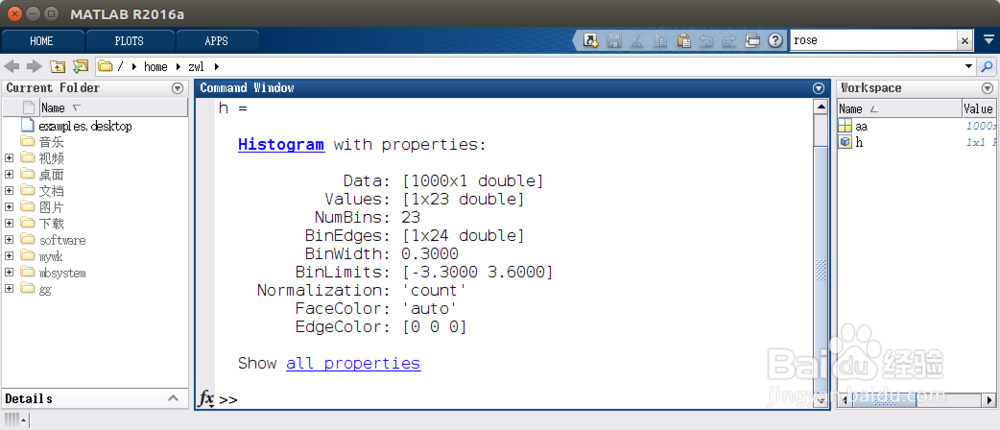
1、这里介绍使用Matlab来对一系列数据进行直方图统计和展示。首先生成一列数据:aa = randn(1000,1);h = histogram(aa);对h进行统计,matlab自动给h进行分列。
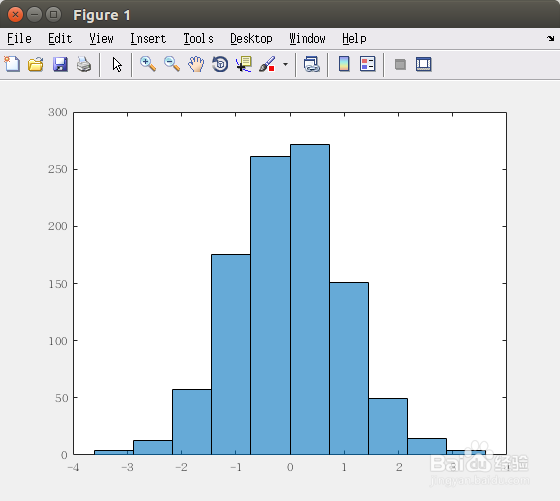
2、可以指定柱状的数量:hh = histogram(aa,10);
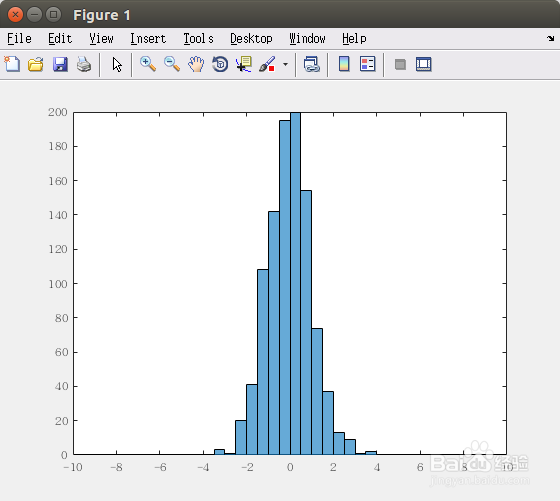
3、还可以对横坐标的范围进行控制:hhh = histogram(aa,[-10:0.5:10]);
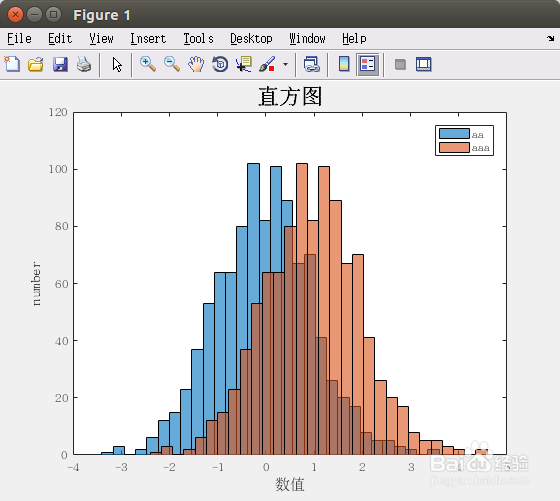
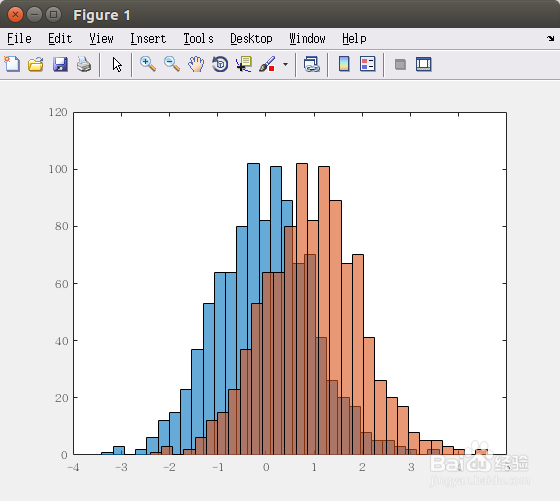
4、还可以将几列数据同时画在一张图上:histogram(aa,30);aaa = 1+aa;hold on;histogram(aaa,30);
5、该绘图如要加入其他要素,与plot命令相同:title('直方图','fontsiz髫潋啜缅e',16);xlabel('数值');ylabel('number');legend('aa','aaa');